
Silver Market Update
Ridgemont High Edition ...


Hey, wait a minute, there's no birthday party for me here!
*************************************
Bag’s primary investment philosophy has always been: It’s easier to judge the long-term direction of the tide (and invest accordingly) than it is to judge individual short-term waves (and trade). Waiting for some degree of certainty on the long-term direction of an asset price means accepting you will never buy the stone bottom or sell the exact top. You can, however, take a big fat slice out of the middle if you ride the tide and allow “time in the market” to do the work.
Identifying the direction of the tide revolves around an ability to distinguish a Bull market from a Bear Market. While that diagnosis might seem easy, it’s far more nuanced than it appears. Increasing time spent riding the tide requires quickly recognizing when a market is transitioning from Bull to Bear, and vice versa. Those turning points matter, as they allow you to maximize your big fat slice.
Long-time readers of this column are aware that we here at Mytwocent$ are very bullish on Silver. We have recommended it multiple times over the last five years at:
Bag has continually pounded the table on Silver because he believes we are in a Secular Bull market. That means the tide is rising, and the time to surf is now.
For only the third time in the last 50 years, this past December & January, Silver was the center of attention in the investment community. In that 10-week period, silver ran from below $50 an ounce to over $120 an ounce. Considering Silver had never traded north of $50 prior, the move was breathtaking. Since the $120 print seven months ago, silver has fallen 54% to its current level just below $58; an equally stunning move. The purpose of today’s essay is to figure out which of those two moves is part of a larger trend.
In short, is Silver in a Bull or Bear?
All commodities, particularly Gold and Silver, exhibit price patterns that are cyclical in nature. It is well known that commodities move in long swings that go from underpriced to overpriced (Bulls), and back to underpriced (Bears) - where the whole cycle starts again. Those cycles are generational, usually lasting about 20+ years. In hindsight, they are easy to spot. Anyone can look at a price chart of Silver for the past 30 years and point out that the 2001 decade low in price to the 2011, 30-year high was indeed a Bull market. Likewise, the trip down from that 2011 high to the Mar 2020 low was, without doubt, a Bear.
Of course, hindsight won’t pay the bills. Recognizing those moves as they unfold, and riding the wave will. It all starts with identifying opportunity.
*******************************************************************

It's a way of looking at that wave and saying, 'Hey, bud, let's party!
Spotting a Bull (in real time):
Bull markets exhibit a distinct rhythm. That rhythm is best described as a series of sustained price rallies that continually print new highs, and are periodically interrupted by sharp, quick pullbacks in price. Those rallies are called Legs, and 98% of Bulls get three to six of them. The time each leg takes to manifest will often, but not always, be roughly equal. In terms of price movement, the percentage gain of each leg tends to increase as the Bull ages, with the Final leg up always being among the largest.
The reasons for these tendencies are psychological. In early legs, very few people believe. Consequently, little capital is available to push prices up. In the later legs, euphoria takes over as everyone piles in - which drives price significantly higher. Even the sharp pullbacks are designed to elicit fear, scaring participants out of their positions.
All of the “Time and Price” traits are on display in the table below, which breaks down the 2001-2011 Silver Bull:
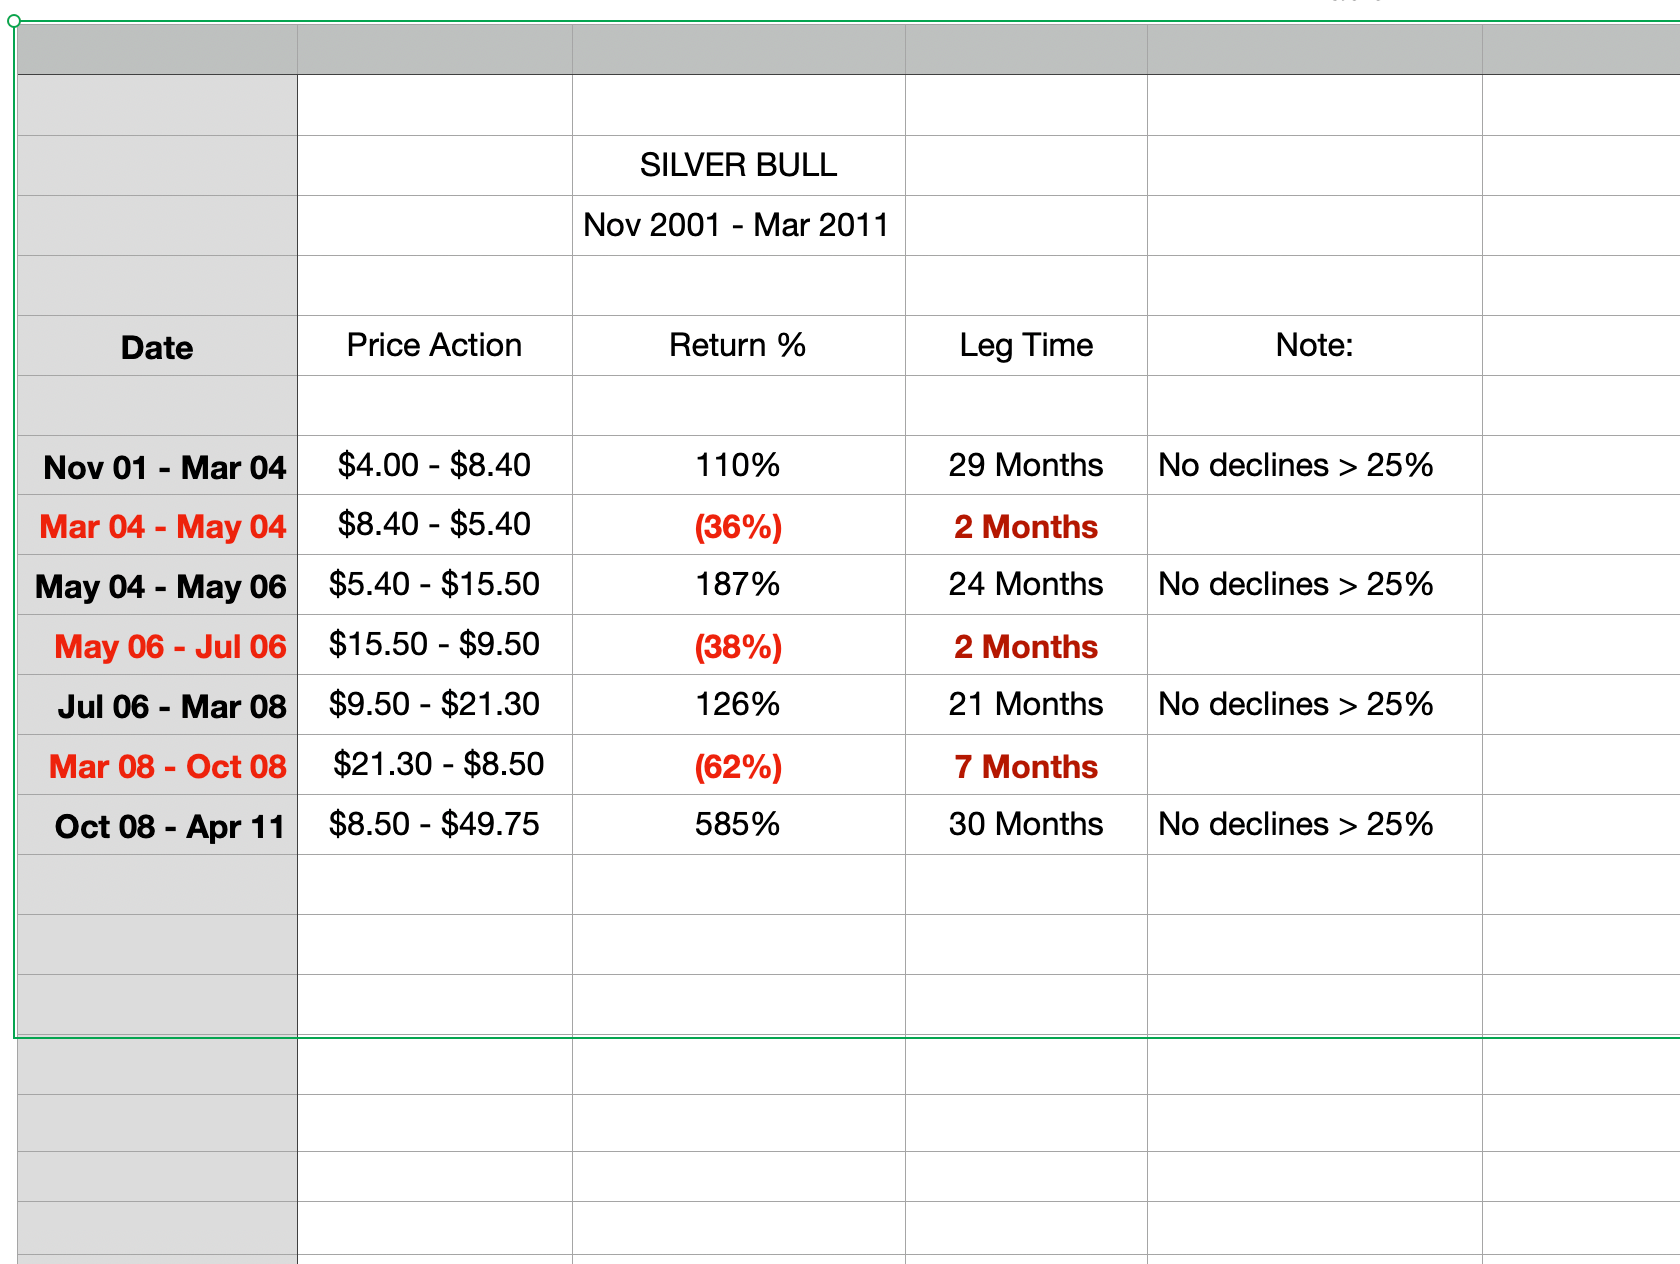
It’s all there: continually printing new highs, with four uplegs averaging 26 months each, interrupted by sharp price drops lasting less than 4 months on average. The initial 110% upleg was the smallest; the Final 585% leg was the largest. Textbook Bull behavior.
******************************************************************************

First he's gonna shit, then he's gonna kill us!
Spotting a Bear (in real time)
Bear market Rhythm is the exact opposite of a Bull in every way, except the number of legs, which will still be 3-6. The legs down in a Bear are a series of sustained drops in price that continually print new lows, and are occasionally punctuated by sharp, quick rallies. In terms of price, the percentage loss within each leg down will be reasonably close in severity. In terms of Time, the length each leg takes to manifest will tend to GROW as the Bear ages.
The reasons, once again, are psychological. The rallies within a Bear are sharp and quick, designed to instill hope in Bulls. The first leg usually unfolds quickly to mimic the appearance of a Bull market pullback. Bulls, conditioned by years of successfully buying the dip, often mistake the initial leg down as an opportunity to allocate fresh capital. The last leg or two of a Bear takes its time, fomenting boredom and apathy in order to flush out all remaining participants.
Again, we have all of these traits on display in the table below, which depicts the 2011-2020 Silver Bear:
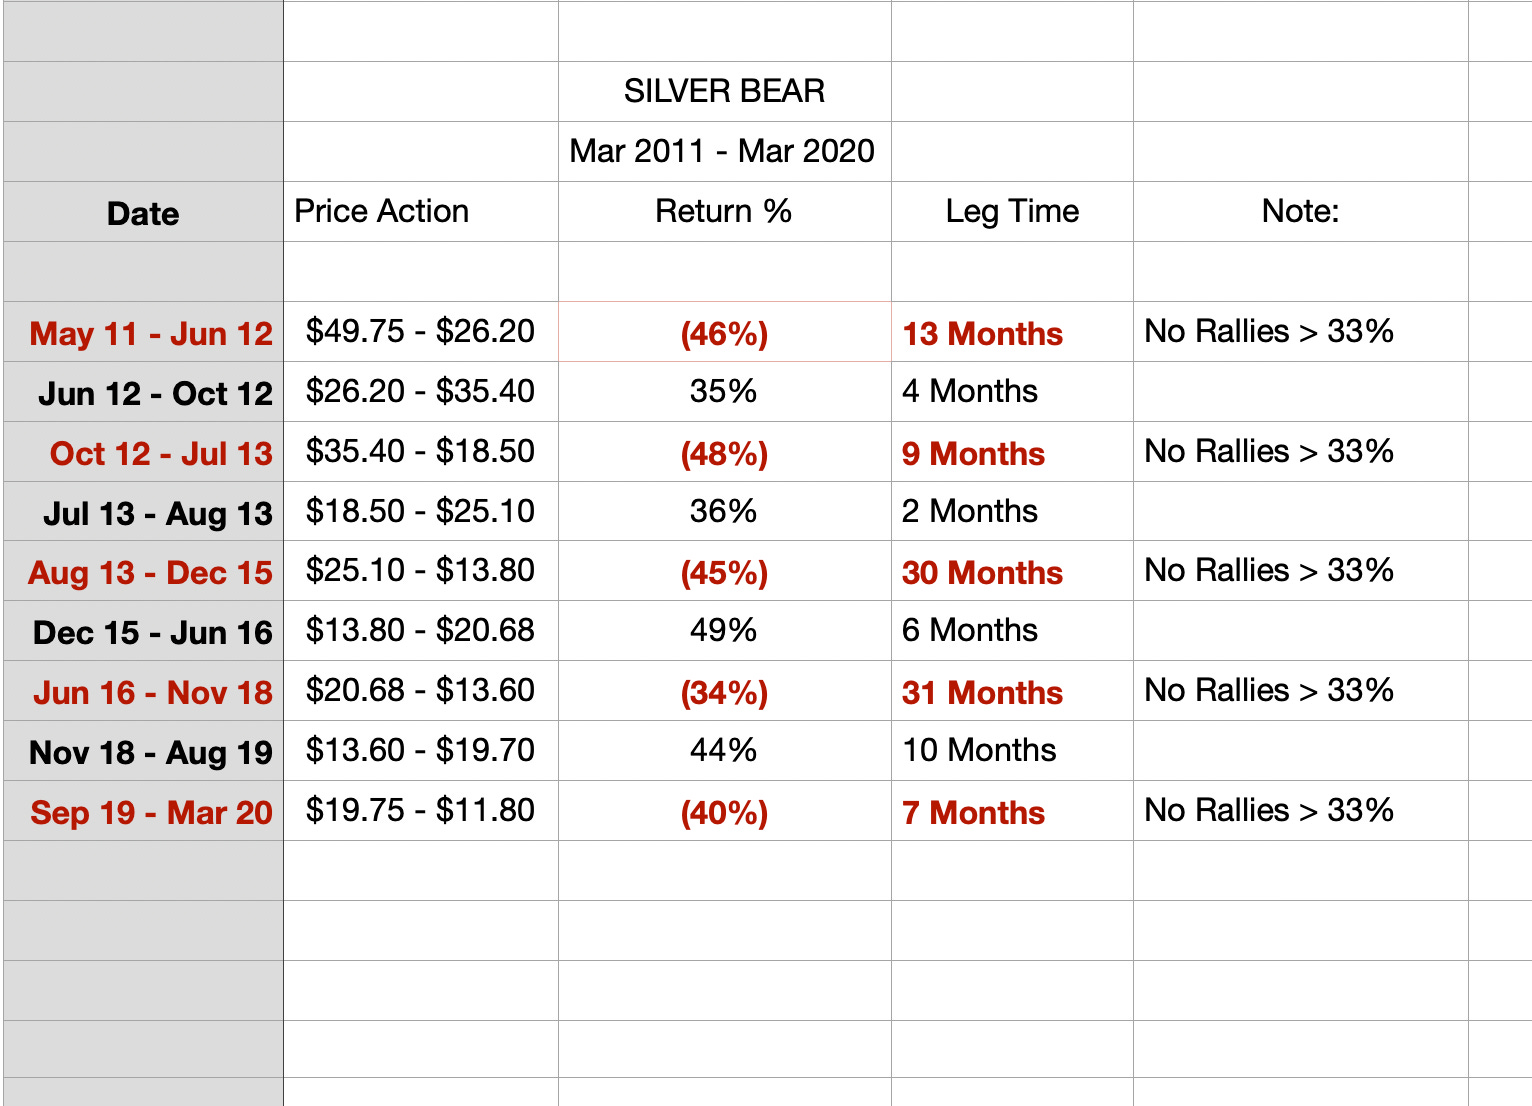
Once again, its all there. Five roughly equal in severity (34-48%) down legs, each printing a new low, all followed by much shorter duration rallies. Textbook Bear behavior.
***************************************************************************

If I'm here and you're here, doesn't that make it our time?
Spotting the Transition (in real time)
This is where the real money is made. There are two types of transitions. Bull to Bear … and … Bear to Bull. Of the two, Bear to Bull is easier to spot in real time. The reason resides in a near-universal truth about how markets behave. That truth is this:
There is an unmistakable “Time and Price” Symmetry between a Bull market and the Bear that follows it. That symmetry is always dictated by the Bull.
If a commodity has a ten-year slow grind to the top, the Bear that follows will be a ten-year slow grind to the bottom. In other words, you won’t see a twenty-year Bull washed away by only a five-year Bear. Simply put, if it took 20 years to suck everyone in, it will take 20 years to flush everyone out.
In effect, Symmetry puts a clock on when to look for the end of a Bear market. Unfortunately, no such clock exists for the Bull to Bear transition, making them trickier to spot. Picking out the Top of a Bull is really just a game of musical chairs where the trick is to secure a chair before the music stops.
The most reliable indication a Bear has bottomed, or a Bull has topped, resides in a Divergence of behavior between Time and Price. For example, the time behavior of a Bull gets coupled with the price behavior of a Bear - or vice versa. It’s those moments of DIVERGENCE: part Bull & part Bear … or as Spicoli would say: “Our Time” …. that signify turning points.
**********************************************************************

Relax, all right? My old man is a television repairman, he's got this ultimate set of tools. I can fix it.
Using all the tools we have about Bulls, Bears, Transitions, and mixing in a dash of Hindsight:
There were multiple obvious clues in March 2020 that should have alerted investors the Bear was giving way to a NEW Bull.
The first is Symmetry. The preceding Bull lasted about 10 years, so 9+ years for a Bear - and 19 years for a complete cycle, would be about right.
The second clue was the divergence in Time & Price of the final leg down. The 40% drop in Price was normal in severity for a Bear, but the seven months it took to get there is NOT Bear behavior. Since the prior two downlegs took 30 months each, it should have taken considerably longer than 7 months.
Even more divergence can be found in the price action coming out of that Mar 2020 low. Silver rallied 152% from 11.80-29.75, making a 9-year high, in under 5 months. After that $29.75 print, Silver spent 2 years gradually pulling back 40% to $18, nowhere near the Mar 2020 lows. 152% uplegs, new highs, and an inability to print new lows on the pullback are consistent with price behavior in a Bull. Five-month rallies followed by a two-year grind down are consistent with the Time behavior of a Bear.
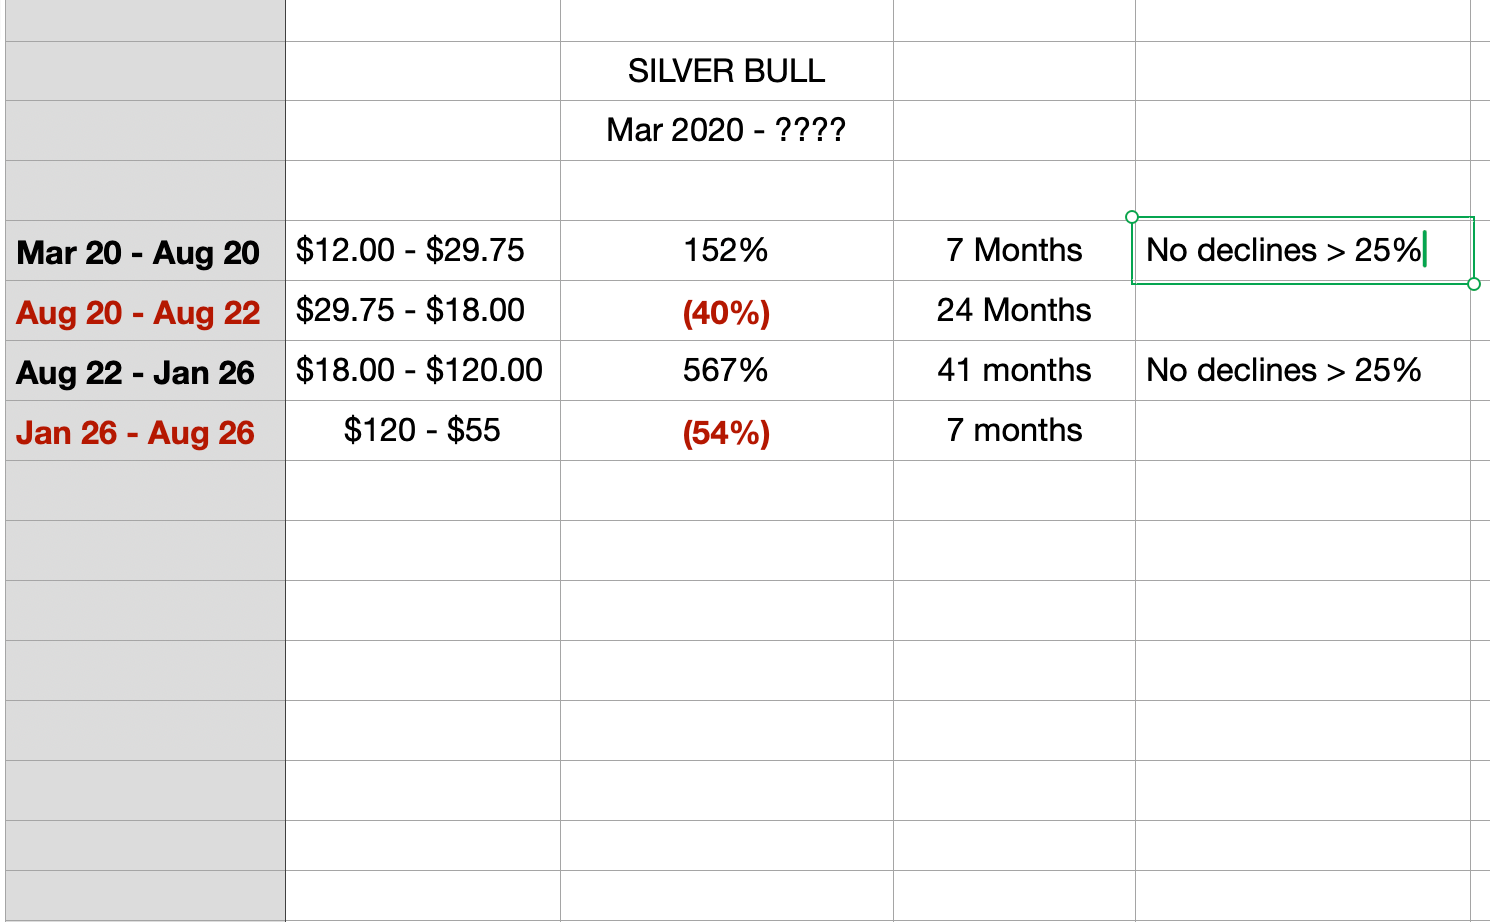
With the gift of hindsight, and the evidence above, we know with certainty a new Silver Bull was born in March 2020. The table below depicts the current state of our Silver Bull:
******************************************************************
Making Sense in Real Time of the Current Silver Market ….
We have printed dozens of multi-year highs since 2020, and NO multi-year lows - that is the stuff of Bulls
Bull markets have 3-6 uplegs; we’ve only had two so far - so another is on the way.
Commodity cycles run 20+ years. If the Bull born in 2020 died this past January at 5 years 9 months, then symmetry dictates the entire cycle would be under 12 years. Nowhere near the usual 20+.
A sharp, quick 54% pullback preceded by a 567% upleg is the “Price” behavior of a Bull.
The current 7-month pullback preceded by a 41-month upleg is the “Time” behavior of a Bull.
Conclusion:
When you put all these facts together, there is simply no evidence of a Bear market in Silver. None. In fact, with no divergence present, there isn’t even evidence of a transition.
So rest assured, The Silver Bull is alive and well. The current 54% pullback, while disconcerting, is nearing an end.
If you are a dispirited Bull, take some solace from this fact:
The moment this pullback ends, we begin another leg up. If it is the last leg of this generational Bull, make no mistake, it will be a Behemoth. Based on what we know about final legs of a Bull, we can expect it to run for 40 months or so, and dwarf the 567% return of the previous leg.
Surf’s up, boys….

Jeff Spicoli's "All I need are some tasty waves, a cool buzz, and I'm fine,"
I was much like him. Fk I still am but have a grey beard now.
My geology professor friend told me to buy gold and silver in 1997. He said I would never get another opportunity like it. I was making biker rings after work in the sawmill. I listened to Elmer and bought lots. I saw it as inventory. If I was a potter I would have bought clay if was on sale and the prof told me clay was rock bottom.
A twist of fate made me stop making jewellery. That silver gold has been sitting for 3 decades.
.999 silver sculptures hidden away in a gun vault.
I did sell off some silver once to get out of debt.
I'll just sit on it and see what happens.
🍻
I have been buying the dip in PM miners and royalty stocks hands over fist. Thanks for the encouraging outlook.